🔍 Project Purpose:
This guided hands-on project simulates a real-world business case. The objective was to build an interactive sales performance dashboard for a fictional US-based e-commerce company using data from 2021–2022.
🛠 Tools & Workflow Practiced:
- Connected Power BI to a SQL Server database
- Cleaned and transformed data using Power Query
- Built a relational data model with multiple tables
- Created a custom Calendar table for time-based analysis
- Applied DAX time intelligence functions such as
TOTALYTD() and SAMEPERIODLASTYEAR()
- Calculated KPIs: YTD Sales, Profit, Quantity, and Profit Margin
📌 Data Source: Practiced and guided by
Data Tutorials on YouTube. Full credit to the original creator.
📊 E-Commerce Sales - Power BI Dashboard:
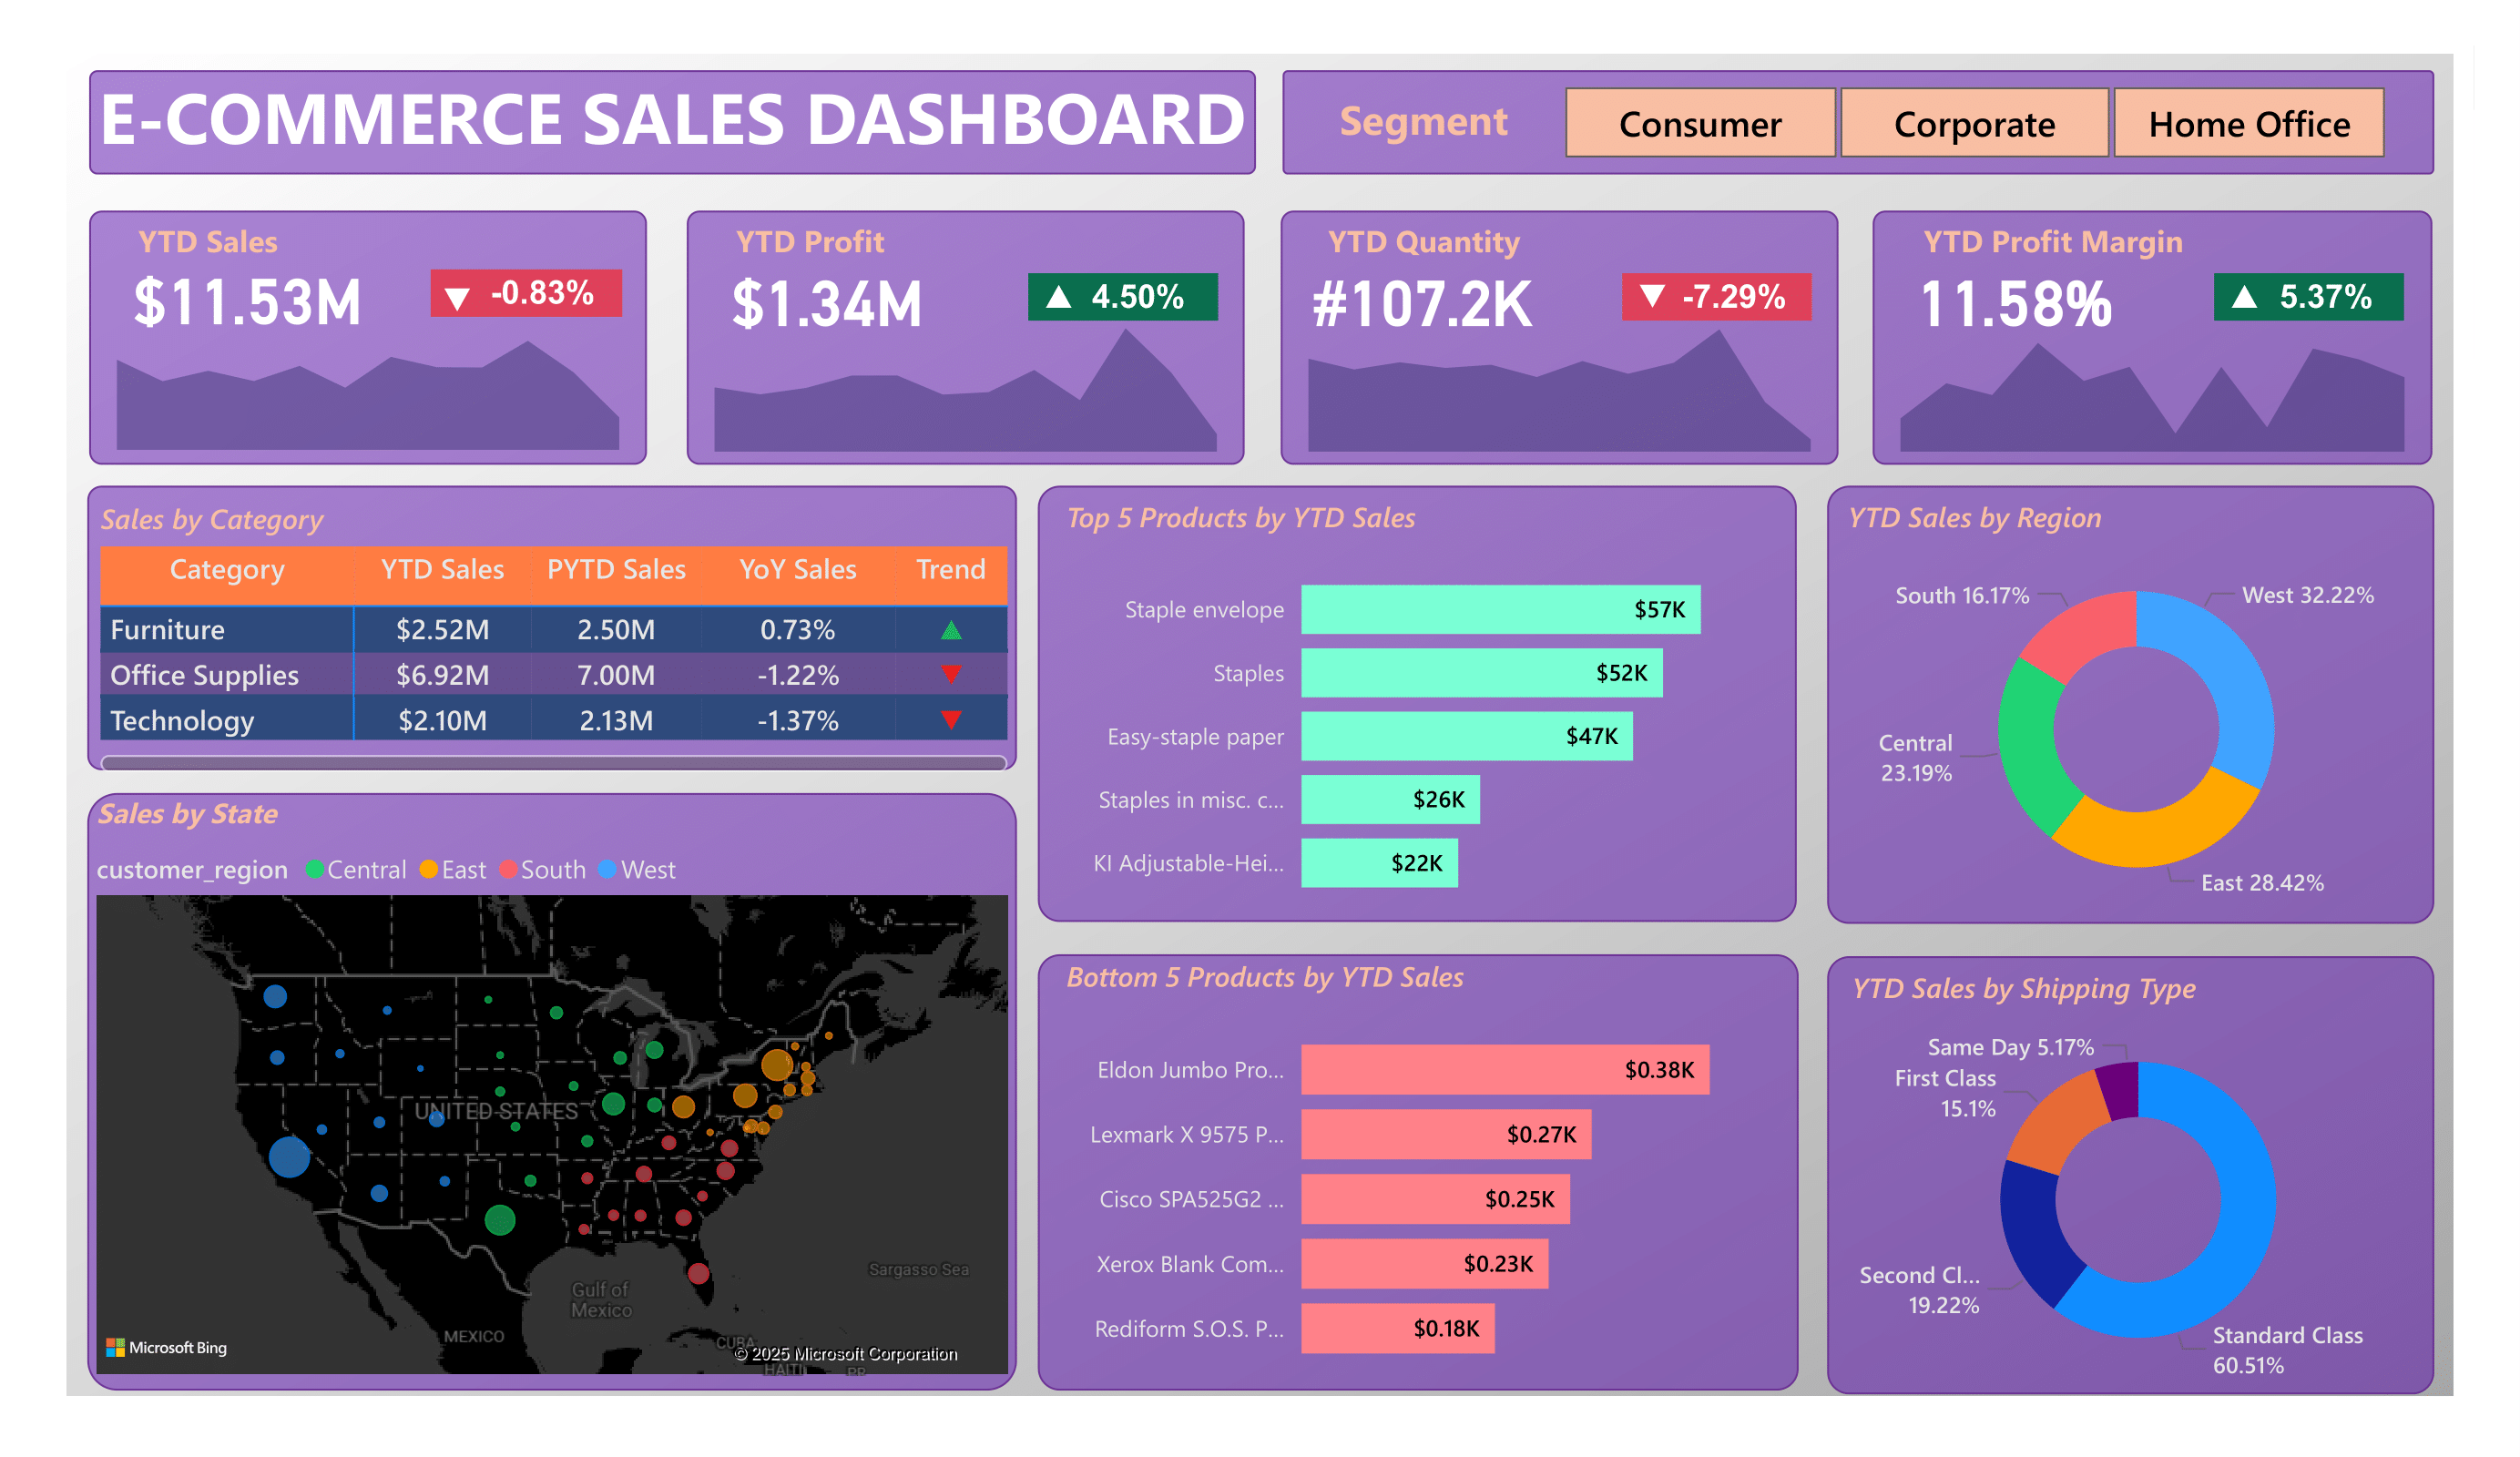
Visual Design Focus:
- Used trend lines and area charts to show monthly performance
- Added dynamic icons and conditional formatting to highlight growth
- Included map visuals (using latitude/longitude) for geographic insights
- Visualized product performance and sales distribution with category, region, and shipping type breakdowns
What I Learned
- Built an end-to-end Power BI reporting workflow using SQL Server and Power Query
- Applied DAX and time intelligence functions (e.g.
TOTALYTD(), SAMEPERIODLASTYEAR()) to track performance over time
- Designed clear, insightful dashboards using trend charts, maps, and category breakdowns
- Made the dashboard easier to read by using colors, icons, and a clear layout.